

MOBILITY NET IMPACT TOOL
A Net Impact Approach for Mobility Solutions
INTRODUCTION
Conventionally, the cost of a particular mode of transport is associated with the direct cost of owning and operating the vehicle. We propose an alternative approach which aims to reflect the true cost of various transport modes by considering external costs associated with the environment, health, and safety of individuals, in addition to the direct cost of ownership and operation.
This toolkit aims to support decision makers in navigating this complex territory by condensing a vastly broad pool of data and literature, cutting through the noise to showcase the net impact of different mobility solutions in dollar terms.
Presenting data and information in this manner can move urban mobility stakeholders closer towards arriving at a more objective conclusion about the costs and benefits of the transportation modes included in our analysis. Additionally, we hope that the effectiveness of mobility solutions can be enhanced by considering context-specific factors.
The toolkit assesses 20 different mobility solutions, assessing existing modes of transportation as well as modes which can potentially be considered for wider adoption in urban settings.
How can you use this toolkit?
Make evidence-based comparisons between different transportation modes (e.g. Which type of bus produces the least emissions?)
Generate values to show the impact of current modes of transportation used in your city
Generate estimate values and projections as a basis for further detailed study
Make an economic case for changing the current fleet composition in your city
Provide quantitative grounding for reporting
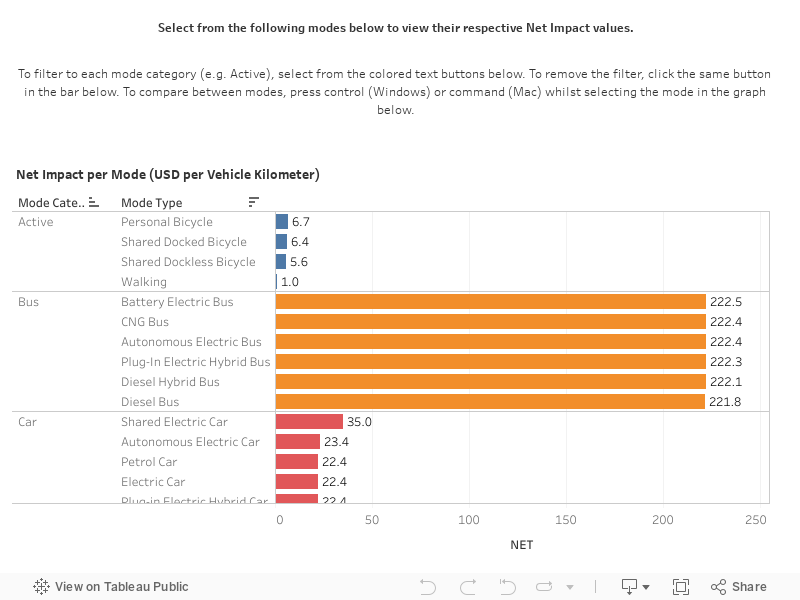
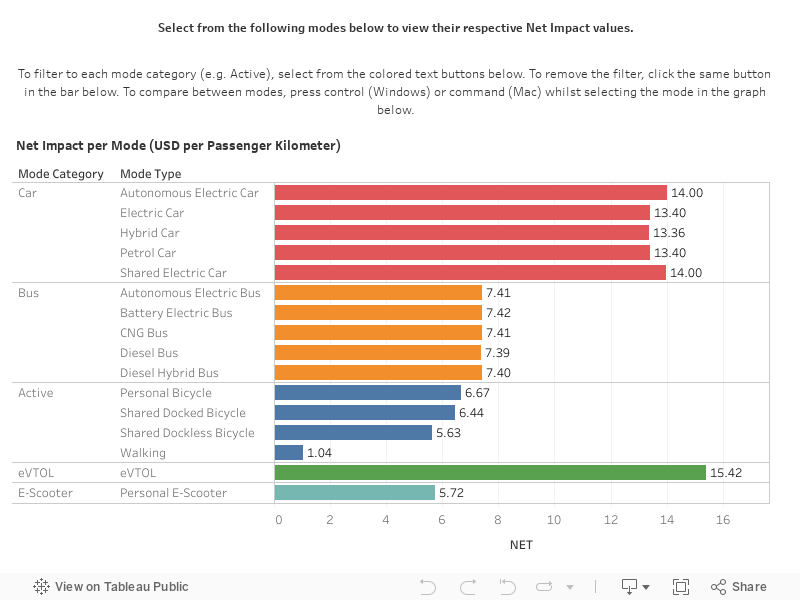
The interactive graphics below allow you to view the net impact created by various transport modalities in USD per passenger-kilometer and per vehicle-kilometer. The Vehicle-Kilometer measures one defined transportation mode (e.g. a certain vehicle type) over a distance of one kilometer. Each vkm assumes an average vehicle occupancy or load factor (e.g. 30 pax per bus). Each Passenger-Kilometer (pkm) measures one individual passenger on a mode of transportation over a distance of one kilometer.
The higher the net impact value, the greater dollar value that mode brings on a per kilometer basis, accounting for emissions, pollution, noise, among other impact parameters assessed in our analysis.

KEY INSIGHTS
Buses bring the greatest value at the vehicle-kilometer level due to their high carrying capacity (an average of 30 pax was used for this calculation) and therefore greater travel time savings at scale.
The net positive impacts of the electric, plug-in hybrid, and hybrid cars are marginally lower than the petrol car, largely due to high costs associated with battery production. Electric or hybrid car batteries require a significant amount of raw material and metals, many of which are mined through energy-intensive and polluting methods, leading to higher GHG Emissions and Air Pollution costs. The difficulty of extracting such materials and their limited supply also result in higher production costs that are translated into Vehicle Ownership costs.
Vehicle Operation costs are higher for shared electric cars than autonomous cars but lower than other types of privately-owned cars because they are mainly used for short-distance, inter-city travel due to relatively costly per-minute pricing model, which disincentivises long-distance travel which would otherwise lower costs.
On a passenger-km basis, the accident rates and severity of accidents associated with e-scooters, whether personal or shared, are the highest among all modes of transportation considered.
Battery-electric buses (BEBs) generate only one-third of air pollution costs compared to diesel buses due to the electric engine which reduces the costs of GHG emissions, air pollutants, noise, as well as operation costs due to less complex engine maintenance requirements. They bring the greatest value within the bus mode category, however, as an electric mode the BEB’s savings are largely dependent on grid emissions.
Going dockless vs docked for shared bicycles could increase vehicle operating costs per km three-fold.
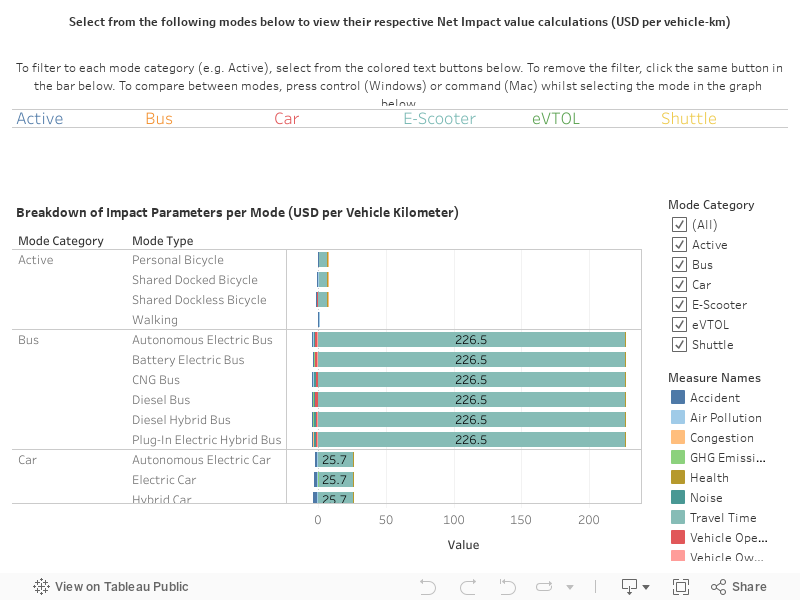
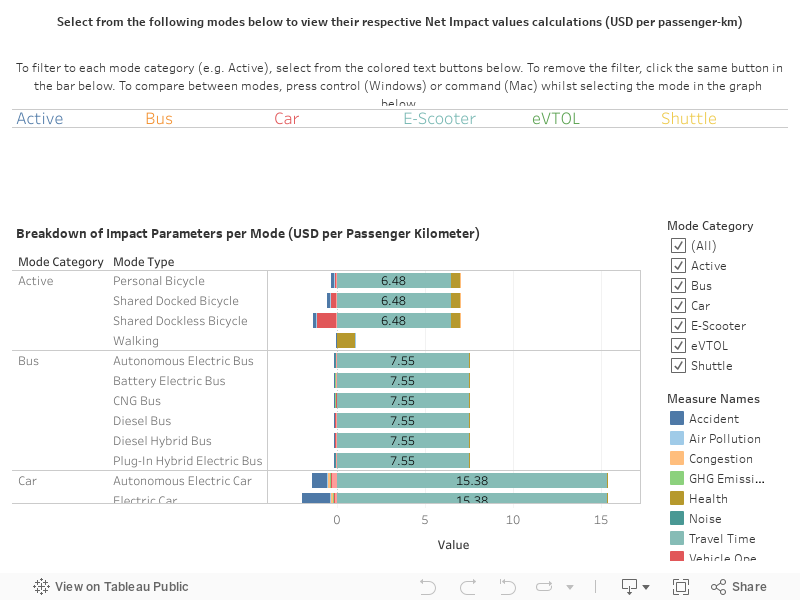
BREAKDOWN OF NET IMPACT CALCULATION
We studied 9 impact parameters in our analysis, including: 1) Vehicle Ownership; 2) Vehicle Operation; 3) Travel Time; 4) Greenhouse Gas Emissions; 5) Air Pollution; 6) Accidents; 7) Noise; 8) Congestion; and 9) Health. Use the dashboards below to explore how each parameter contributes to the net impact calculation.
Interested in learning more about this impact calculation methodology and how it might apply to your organisation’s work? Reach out to the Eden team at query@edenstrategyinstitute.com to learn more.